
How to Measure ASO: KPIs, Metrics & Reporting
Quick answer: Measure ASO with four core metrics: keyword rankings (visibility), impressions and product page views (reach), conversion rate (impressions → installs), and an overall ASO score for the trend. Track them per market on both platforms: daily for rankings, weekly for reporting. The mistake is measuring installs alone: installs move for many reasons, so ASO is proven by rankings plus conversion, not by a download number in isolation.
Last updated: June 2026.
ASO without measurement is decoration: you can't tell whether a metadata change helped, hurt, or did nothing. But "more downloads" is a misleading scoreboard, because installs rise and fall for reasons that have nothing to do with your listing. This guide defines the metrics that actually isolate ASO performance, where to find them, and how to report them so stakeholders trust the work. It's the measurement half of the App Store Optimization guide.
Why "installs" alone is the wrong headline metric
Installs are an outcome, influenced by seasonality, paid campaigns, press, virality, and platform changes, not just your ASO. If you report installs and they rise, you can't prove ASO did it; if they fall, you can't prove it didn't. To measure ASO specifically, you measure the things ASO directly moves: where you rank and how well you convert.
The four core ASO KPIs
| KPI | What it measures | Where it lives |
|---|---|---|
| Keyword rankings | Visibility: your position for target terms | Rank-tracking tools (stores don't expose this) |
| Impressions | Reach: how often you appear | App Store Connect / Play Console |
| Conversion rate | Impressions → product page views → installs | App Store Connect / Play Console |
| ASO score | A single composite for trend-at-a-glance | ASO tools |
- Keyword rankings are the leading indicator: metadata changes show here first. Track them per market, on both platforms, daily, because that's where competitor moves and algorithm shifts surface first.
- Impressions tell you whether your visibility work is expanding reach.
- Conversion rate is the cleanest measure of creative quality: it isolates "did people choose us once they saw us." Track impressions → product page views → installs as a funnel.
- An ASO score rolls the inputs into one trend line so you can spot regressions without reading five dashboards.
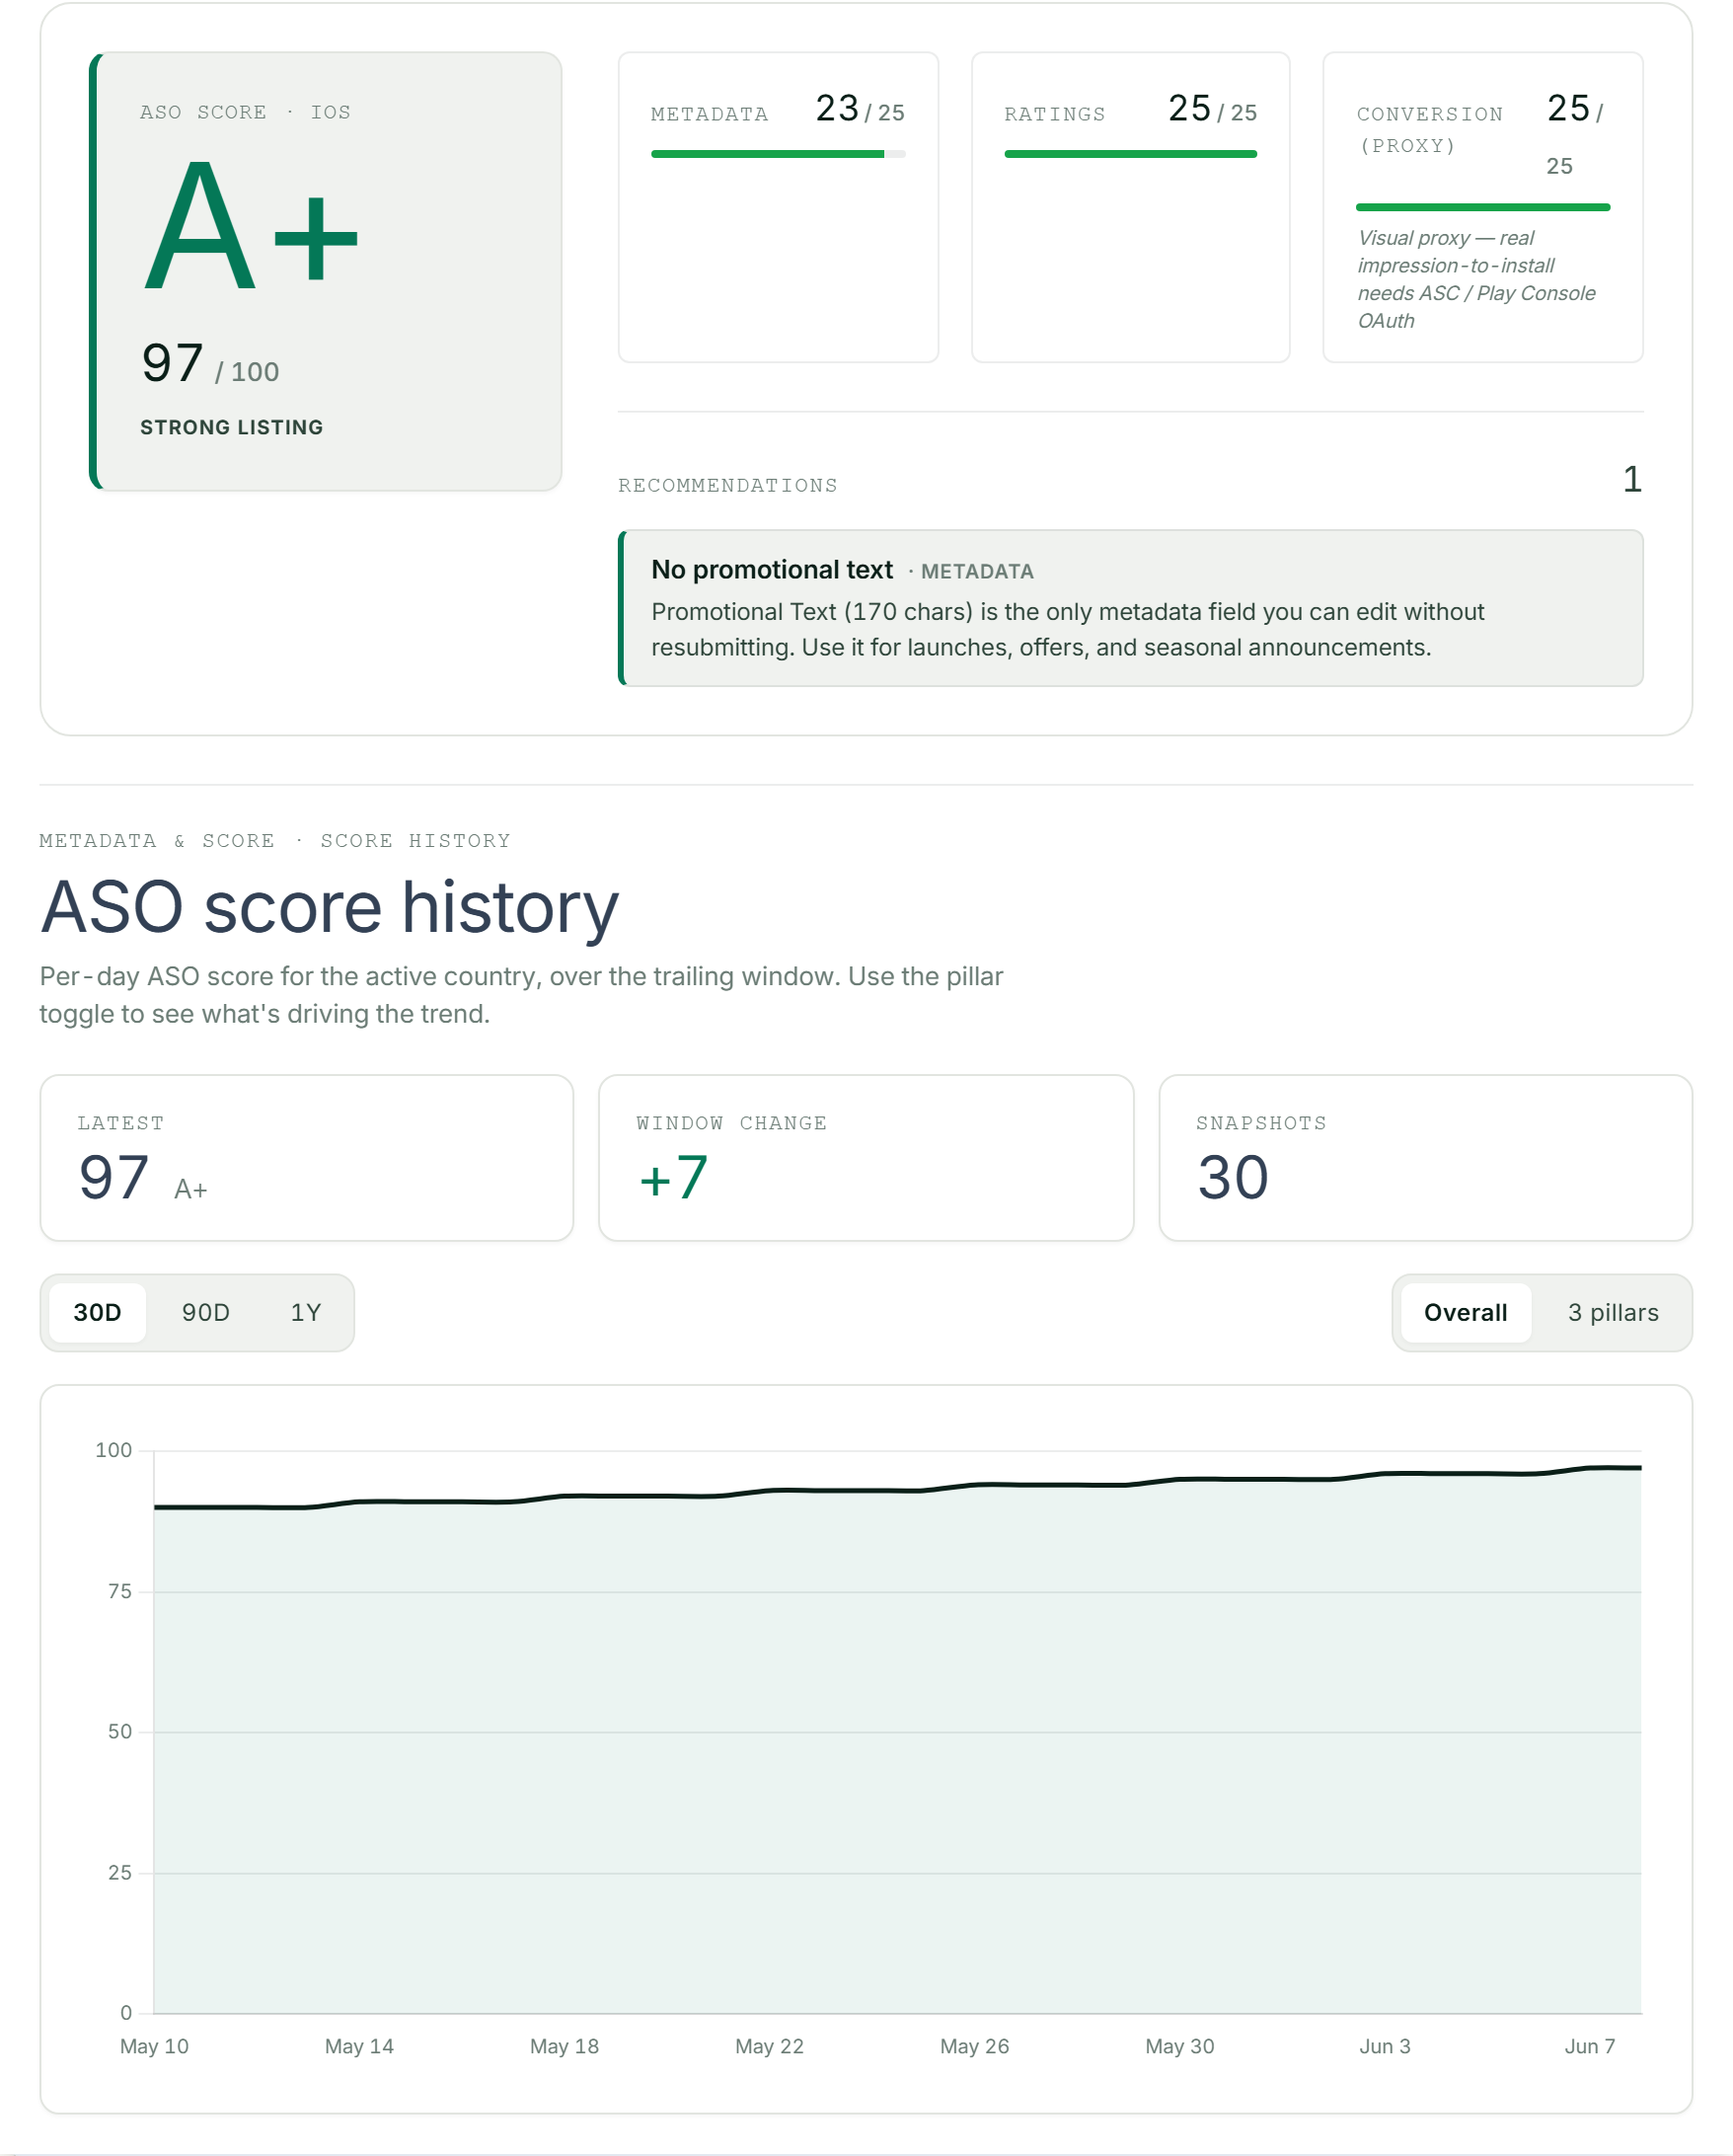
An ASO score with its pillar breakdown, tracked over time to catch regressions.
Where the data lives
- Reach + conversion: App Store Connect (App Analytics) and Google Play Console give you impressions, product page views, and conversion rate, the store-side truth.
- Keyword rankings: neither store exposes your rank for arbitrary terms, so you need a rank-tracking tool. ASOScan tracks rankings 200 positions deep on both iOS and Android, per market, and snapshots an ASO score over time.
Leading vs lagging indicators
- Leading (move first, predict the future): keyword rankings, conversion-rate changes after a screenshot test.
- Lagging (confirm the past): installs, revenue, retention cohorts.
Manage to the leading indicators: they tell you whether today's change is working before the lagging install number catches up weeks later.
Reporting cadence
- Daily: glance at keyword rankings and any competitor-change or rank-anomaly alerts.
- Weekly: a short report covering ranking movement on priority terms, conversion-rate trend, ASO score week-over-week, and what changed.
- Monthly/quarterly: the strategic review covering wins, what's next, market expansion, competitor shifts.
Reporting to stakeholders
A CMO or founder doesn't want a keyword spreadsheet. They want the story:
- Lead with the outcome trend (conversion rate, ASO score) and the why.
- Show movement, not absolutes: "+18% conversion after the screenshot test," not a static number.
- Tie it to the business: visibility and conversion gains, translated into organic-install impact.
- Be honest about attribution (below).
A clean, repeatable report builds trust in the channel. ASOScan generates editorial PDF reports and weekly digests for exactly this. See reports.
The attribution caveat (be honest)
ASO rarely gets clean credit, because organic installs, paid, seasonality, and PR all move together. Don't claim every install. Instead:
- Attribute what ASO directly moved: rankings and conversion rate.
- Separate organic from paid in the store consoles where you can.
- Note confounders (a holiday, a press hit, a paid push) in the report rather than letting them inflate or mask your numbers.
Honest measurement is more credible than a heroic install chart, and it survives the quarter when installs dip for reasons outside your control.
Common measurement mistakes
- Reporting installs as the ASO scoreboard: too many confounders.
- Not tracking rankings: you lose the leading indicator and fly blind on competitor moves.
- Ignoring conversion rate: the cleanest measure of your creatives.
- Measuring once a month: rankings and competitors move daily; you miss the cause.
- Claiming all credit: kills trust the moment a confounder is obvious.
Frequently asked questions
What KPIs should I track for ASO?
Four: keyword rankings (visibility), impressions (reach), conversion rate (impressions → installs), and an overall ASO score for the trend. Rankings and conversion rate are the most ASO-specific: they isolate what your listing directly controls. Track them per market on both platforms, daily for rankings and weekly for reporting.
Is the number of downloads a good ASO metric?
Not on its own. Installs are an outcome influenced by seasonality, paid spend, press, and virality, so a download number can't prove or disprove that your ASO worked. Measure ASO by what it directly moves (keyword rankings and conversion rate) and treat installs as a lagging confirmation rather than the headline metric.
How often should I check my ASO metrics?
Check keyword rankings and alerts daily (that's where competitor moves and algorithm shifts surface first), produce a short report weekly (ranking movement, conversion trend, ASO score), and run a strategic review monthly or quarterly. ASO is a moving target, so a monthly-only cadence misses the cause of changes while they're still actionable.
How do I report ASO results to stakeholders?
Lead with the outcome trend (conversion rate and ASO score) and the reasons behind it, show movement rather than static numbers ("+18% conversion after the screenshot test"), tie it to organic-install impact, and be honest about attribution. A clean, repeatable weekly or monthly report, ideally a polished PDF, builds far more trust than a raw keyword spreadsheet.
Where do I find App Store conversion rate?
In the store consoles: App Store Connect's App Analytics for iOS and Google Play Console for Android both report impressions, product page views, and conversion rate. For keyword rankings, which the stores don't expose for arbitrary terms, you need a dedicated rank-tracking tool, since that data isn't available natively.
Measurement makes most sense alongside the complete ASO guide and ASO score feature.